What is a data warehouse and why does your company need one?
What is a data warehouse: how it differs from a transactional database and a data lake, facts and dimensions, ETL and ELT, layers and how to start small.
In short
- A data warehouse is a database built for analysis that brings together several systems, applies single rules and keeps history to produce reliable BI metrics.
- The transactional database records operations and the data lake stores raw files; the data warehouse delivers clean, modeled data ready for queries and reports.
- Dimensional modeling organizes data into fact tables, with events and numbers, and dimension tables, with the context that becomes filters in reports.
- Start with one subject area, with bronze, silver and gold layers, quality checks and validation of the numbers with the business before expanding.
Every mid-size or large company reaches a point where the same question has three answers. Finance pulls revenue from the ERP, sales pulls it from the CRM, operations has its own spreadsheet, and the results meeting turns into a debate about which number is right.
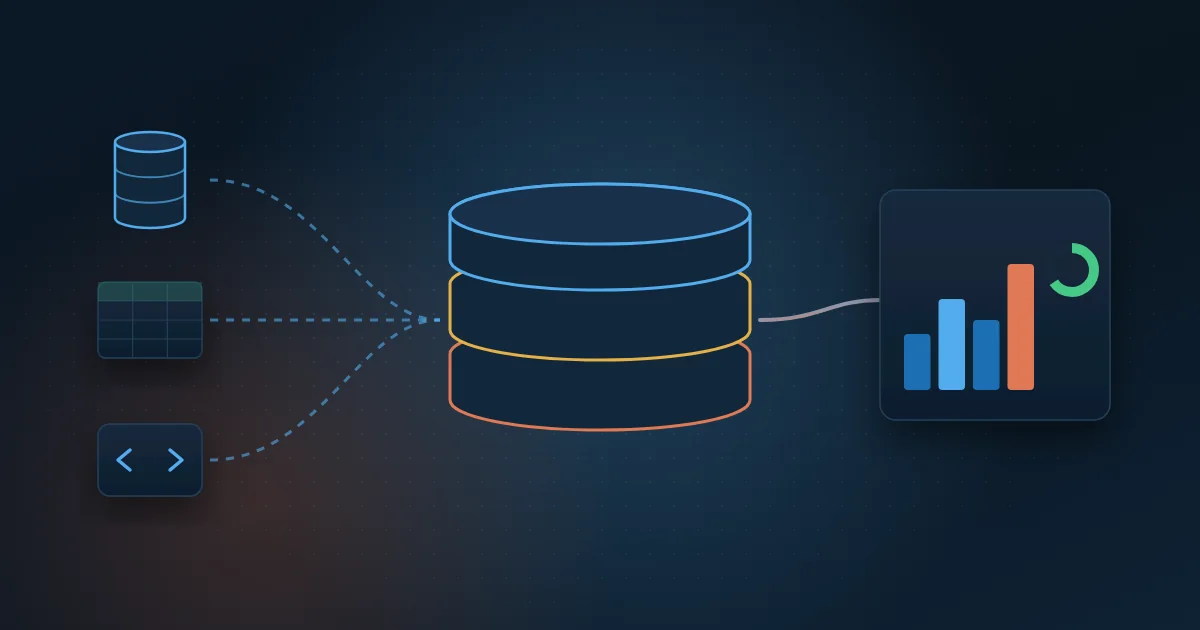
A data warehouse is a database built for analysis. It brings together data from several systems, applies the same business rules, keeps history and organizes everything in a format that is easy to query in BI tools such as Power BI. It is the foundation that turns scattered data into reliable metrics.
In this guide you will understand what a data warehouse is for, how it differs from a transactional database, a data lake and a lakehouse, how modeling with facts and dimensions works, which tools to use and how to start small.
Why does your company need a data warehouse?
Everyday systems, such as ERP, CRM and customer service platforms, were built to record operations, not to answer management questions. Heavy queries slow these systems down, each one uses its own codes and many don't keep a history of changes. The data warehouse creates a layer just for analysis and is the heart of any business intelligence project.
Some examples by area:
- Finance: a management P&L that combines accounting, cost centers and budget without intermediate spreadsheets.
- Sales: revenue, margin and targets by sales rep, region and product, with the same rules in every report.
- Operations: inventory, delivery times and productivity, with history to compare periods.
- Contact center: data from the telephony platform, the CRM and the satisfaction survey in the same model, by agent and by queue.
- Energy: plant generation, utility bills and credits per contract in a single, auditable base.
Data warehouse, transactional database, data lake and lakehouse: what is the difference?
The four terms show up together in any conversation about data, but they solve different problems.
Transactional database
It is the database behind an operational system, such as the ERP. It is optimized to write and update many small records quickly, such as an order or a payment. This use is called OLTP, short for online transaction processing.
Data warehouse
It is optimized to read and aggregate large volumes, such as monthly revenue over the last five years. Data is structured, clean and organized by subject. This use is called OLAP, or online analytical processing.
Data lake
It is a low-cost file repository that accepts any format: tables, JSON, images, logs. It is flexible, but without organization it becomes a data dump that is hard to use and to trust.
Lakehouse
It combines both worlds: the cheap, open storage of a data lake with the structured tables, transactions and performance of a data warehouse. Platforms such as Microsoft Fabric follow this model, with Delta-format tables stored in the data lake.
How does dimensional modeling work?
Dimensional modeling is the most widely used way to organize a data warehouse for analysis. It splits data into two types of tables:
- Fact table: records measurable events, such as sales, answered calls or energy generated. Each row has numbers, such as amount, quantity or duration, and keys that point to the dimensions.
- Dimension tables: describe the context of the event, such as customer, product, sales rep, branch and date. They become the filters and groupings in reports.
With the fact table in the center and the dimensions around it, the diagram looks like a star, hence the name star schema. This format is easy for business people to understand and is the one Power BI processes with the best performance.
The most important decision is the grain, that is, what one row of the fact table represents: an invoice line, a whole order or the daily total. Define the finest grain the business really needs. With a detailed grain you can always add up; with an aggregated grain you cannot go back to the detail.
How does data get into the data warehouse?
ETL or ELT
In ETL (extract, transform, load), data is processed before it enters the data warehouse, in an intermediate tool. In ELT (extract, load, transform), raw data is loaded first and transformed inside the platform itself, with SQL or Python. With cheaper cloud storage and more powerful processing engines, ELT has become the standard in new projects, because it preserves the original data and makes it easier to reprocess when a rule changes.
Bronze, silver and gold layers
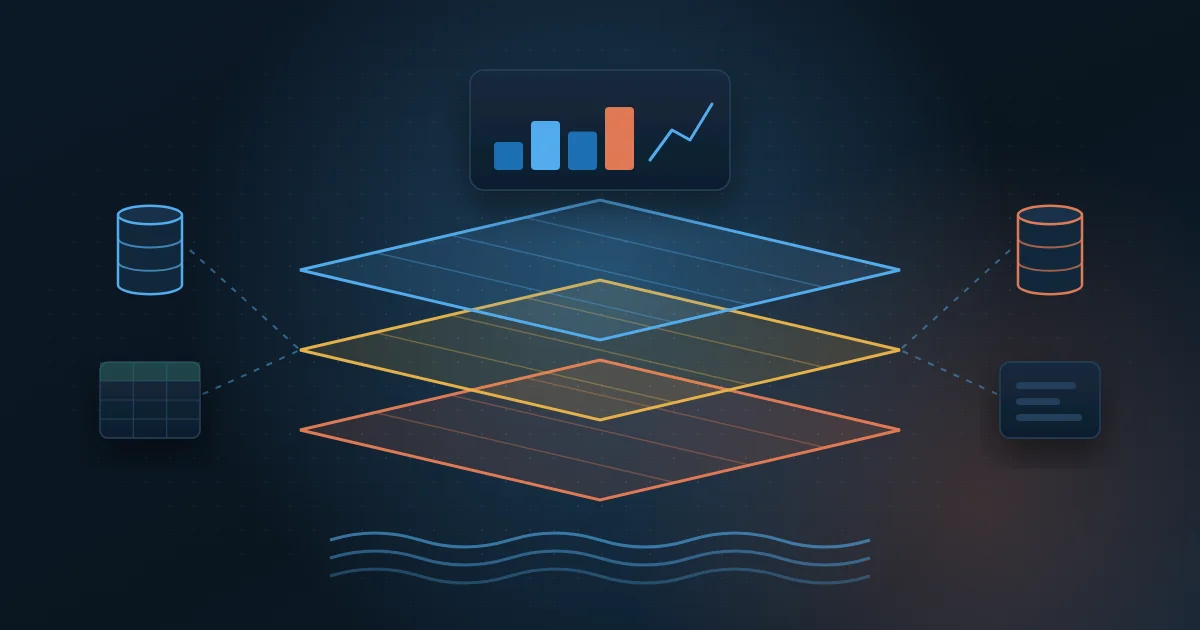
A common way to organize ELT is a layered architecture, also called medallion architecture:
- Bronze: raw data, as it came from the source, for auditing and reprocessing.
- Silver: clean, standardized data, with correct types, duplicates removed and unified codes.
- Gold: fact and dimension tables ready for consumption, with business rules applied.
Data quality and history
A data warehouse only earns trust if the numbers match. Include automatic checks on every load: row counts against the source, value totals, empty required fields and keys with no match. When a check fails, the team should be alerted before the director opens the dashboard.
History is another gain. If a customer moves to another region or a sales rep changes teams, the ERP usually overwrites the record. In the data warehouse, you can keep each version with start and end dates, a technique known as a type 2 slowly changing dimension. That way, last year's sales stay in the right region.
Which tools should you use to build a data warehouse?
There is no single right tool for everyone. The choice depends on volume, the team and what the company already uses:
- SQL Server: a good option if you already have your own infrastructure and Microsoft licenses, with many professionals available in the market.
- Azure SQL: the same engine as SQL Server as a managed cloud service, with no server, backup or update work.
- PostgreSQL: an open source database, robust and with no license cost, that runs on your own server or in any cloud.
- Microsoft Fabric: a complete platform with Lakehouse, Warehouse, pipelines and Power BI integrated, suited to many sources, growing volume or a need for near real-time data.
To orchestrate loads, you use Fabric or Azure Data Factory pipelines and Python scripts. To visualize, Power BI or custom web dashboards.
How do you start a small data warehouse?
The classic mistake is trying to model the entire company before delivering the first dashboard. Start with one subject area, such as sales or finance, deliver value early and expand later. Follow these steps:
- Pick an area with a clear pain point and an owner who will use the data every week.
- List 5 to 10 questions that area needs to answer and the metrics tied to them.
- Map the sources of each metric and who is responsible for each system.
- Define the grain of the fact table and the dimensions you need, starting with date, customer and product.
- Build the bronze, silver and gold layers with incremental loads and quality checks.
- Validate the numbers with the business area, side by side with current reports.
- Publish the dashboards, document the rules and only then move on to the next area.
Checklist before going live:
- The definitions of each metric are written down and approved by the business area.
- Loads run on their own, on a set schedule, and alert you when they fail.
- Totals match the source within an agreed tolerance.
- Access is controlled by profile, with special care for personal data subject to LGPD (Brazil's data protection law).
- There is a technical owner and a business owner for the model.
Which mistakes should you avoid when building a data warehouse?
- Copying the ERP tables as they are and calling it a data warehouse, with no modeling.
- Starting with the tool instead of starting with the business questions.
- Applying business rules inside each report instead of applying them once in the gold layer.
- Reloading everything from scratch every night when an incremental load would do.
- Ignoring history and losing sight of what records looked like in the past.
- Not monitoring quality and finding errors only when a manager complains.
How Wolkee helps
Wolkee designs and builds data warehouses with SQL, Python, Microsoft Fabric and Azure, from modeling the first tables to dashboards in production. Over 9 years and more than 500 deliveries, we have worked with ERP, CRM, contact center and solar energy data. See how our data engineering service works.
If you want to understand where to start, book a free 30-minute assessment. We review your sources, suggest the first subject area and show you a working prototype before the contract. We reply within 1 business day.
Frequently asked questions
What is the difference between a data warehouse and a database?
Every data warehouse is a database, but not every database is a data warehouse. The database behind a system such as the ERP is built to record operations quickly. The data warehouse is built for analysis: it brings together several sources, keeps history and organizes data into facts and dimensions for fast queries in BI tools.
Is Power BI a data warehouse?
No. Power BI is a modeling and visualization tool for reports. It stores data in its semantic models, but it was not built to integrate many sources, keep long-term history and serve as the single source for other systems. Ideally, Power BI consumes data from a data warehouse, with business rules already applied.
What is a data mart?
A data mart is a slice of the data warehouse dedicated to one area or subject, such as sales, finance or the contact center. It contains the fact and dimension tables that area uses. Starting with a data mart is a practical way to build the data warehouse gradually, as long as common dimensions, such as customer and product, are shared across areas.
How long does it take to implement a data warehouse?
It depends on the scope, the number of sources and the quality of the data. A data warehouse that covers the entire company is built in waves, over time. A first subject area, with few sources and well-defined questions, reaches production much sooner. That is why the recommendation is to start small, deliver value early and expand area by area.