Business Intelligence: what it is and why your data still isn't working for you
What is business intelligence? See how the BI cycle works in practice and why having Power BI installed is not enough to make decisions with data.
In short
- Business intelligence (BI) is the set of processes, tools and practices that turns raw data from systems and spreadsheets into information for making decisions.
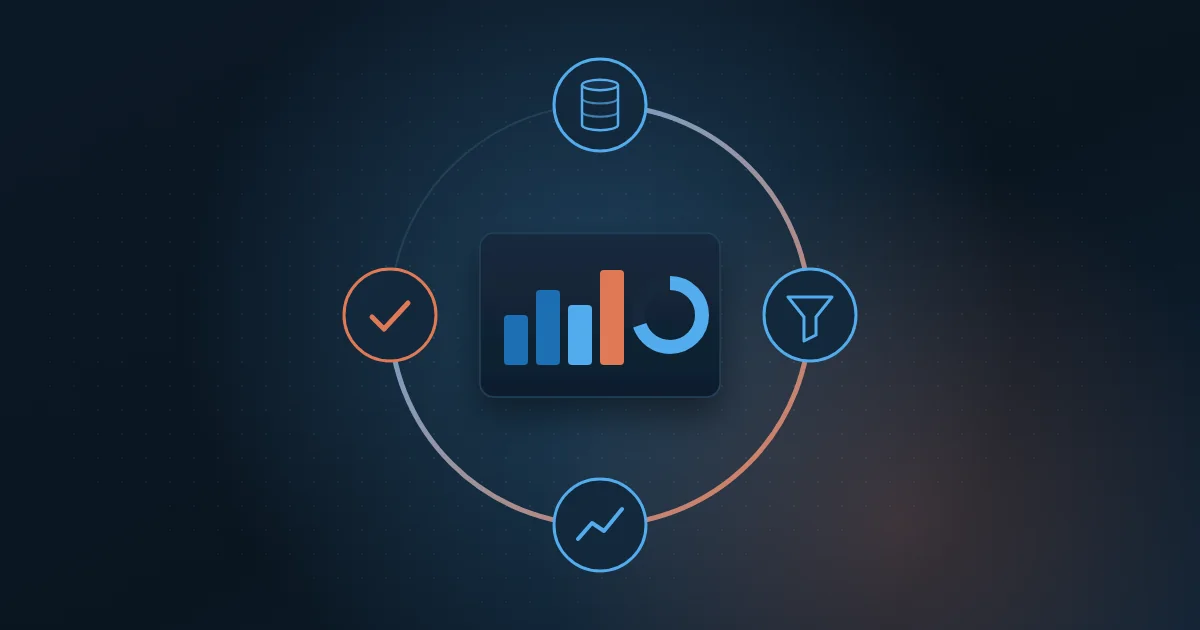
- The BI cycle has four stages that must work together: collection and integration, organization and quality, analysis and visualization, and decision and action.
- The right order to implement BI is to integrate systems, validate the data, define owners and processes, and only then choose and configure the visualization tool.
You have data. Probably a lot of it.
You have a billing system, an ERP, the finance team's spreadsheet, the sales report and three more tools someone bought last year.
The problem isn't a lack of data. It's that none of this data talks to each other.
What is Business Intelligence, in plain terms?
Business Intelligence, or BI, is the set of processes, tools and practices that turns raw data into information you can use to make decisions.
It's not about having a pretty dashboard. It's about knowing, at any moment, what is happening in your business, why it is happening and what to do about it.
The practical difference: without BI, you find out a problem existed when it's already too late. With BI, you see the deviation before it becomes a crisis.
Why do most companies have data but no intelligence?
Having a system isn't having BI. Having reports isn't having BI. Having Power BI installed isn't having BI.
Three situations that repeat in almost every company that isn't there yet:
- Each department has its own number and nobody agrees when the data meets in the meeting
- The report takes two days to be ready and, when it is, it's already outdated
- The manager makes decisions with last month's data because it's the only data available
This isn't a tool problem. It's a structure problem. The data exists but isn't integrated, has no clear owner and doesn't provide real-time visibility.
Data without context isn't intelligence. It's noise.
How does BI work in practice?
The BI cycle has four stages. All of them need to work together for results to show.
1. Collection and integration
Data needs to leave the systems where it lives and reach a single place. Billing, operations, tax, CRM, field data. When these systems don't talk to each other, each one tells part of the story and nobody sees the whole picture.
Integration is where most companies get stuck. Not because of technology, but because of the messy foundation that comes before any tool.
2. Organization and quality
Collected data isn't reliable data. Before it becomes insight, data needs to be validated, standardized and classified. Fields filled in wrong, duplicate records, inconsistent formats across systems: each of these problems contaminates the final result.
A manager who doesn't trust the dashboard doesn't use the dashboard. And goes back to the spreadsheet.
3. Analysis and visualization
With the foundation organized and integrated, data becomes a dashboard. Real-time metrics, historical comparisons, automatic alerts when something goes off track.
This is where the tools you probably already know come in: Power BI, Tableau, Looker Studio. The tool isn't BI. It's the last step of a process that starts long before it.
4. Decision and action
The end goal isn't to have a pretty dashboard in the meeting. It's to make a better, faster decision with less risk of being wrong.
BI that doesn't change how decisions are made isn't working. No matter how many charts it shows.
What does BI show in each department's day-to-day work?
A definition helps. An example helps more. A well-structured BI answers, in one place, the questions each department answers today with spreadsheets and manual effort:
- Finance: revenue, margin and cash flow by unit, with actuals compared to budget
- Sales: sales funnel, average ticket and conversion by rep, region or channel
- Operations: productivity, deadlines and deviations by team, contract or unit
- Contact center: service level, abandonment and AHT by queue and by hour of the day
- Leadership: key indicators from every department on the same screen, with a single number for each metric
What these examples have in common: each indicator has a single definition, a known source and an owner. That is what gets sales and finance into the meeting with the same number.
What are the real benefits of BI for people who run operations?
Let's skip the abstract terms. Here's what changes day to day for those who truly implement BI:
- A report that took two days to close becomes available in real time
- Decisions that depended on someone compiling data by hand become based on an automatically updated dashboard
- Operational deviations that used to show up at month-end close are identified on the day they happen
- A team that spent hours producing data now spends that time analyzing and acting
The impact isn't only on efficiency. It's on the quality of decisions. And better decisions have measurable results.
Which types of companies benefit most from BI?
Any company that makes decisions based on data, which in practice means any company.
But the impact is more immediate and visible in operations that:
- Manage multiple units, branches or contracts at the same time
- Run high-volume billing, collection or allocation processes
- Rely on real-time visibility to avoid losing revenue or operational control
- Have already tried to solve the problem in-house or with a generic tool and failed
In energy, contact center, healthcare and food, the industries where Wolkee works, the lack of BI has a direct and measurable cost: billing errors, lost credits, wrong sizing, decisions made with yesterday's data.
BI doesn't start with the tool. It starts with the foundation.
This is the most common and most expensive mistake.
The company buys a BI tool before organizing its data foundation. The tool shows pretty charts with bad data. The manager doesn't trust it. Stops using it. Concludes that BI doesn't work.
The right sequence is: integrate systems, organize and validate data, define owners and processes, and only then choose and configure the visualization tool.
It seems obvious. But most companies reverse this order because the tool is what shows up in sales presentations. The structure doesn't show up, but it's what determines whether results come or not.
How does Wolkee approach this?
Wolkee doesn't sell BI tools. It builds the full path: from integrating the systems that don't talk to each other today to the dashboard the manager will use every day to make decisions.
The process starts with an in-depth assessment of the client's business. We don't show up with a ready-made solution. We show up to understand where the real bottleneck is before proposing anything.
Delivery doesn't take months. The first results show up in weeks, with an agile methodology and small, visible deliveries. The client sees progress from the start.
And Wolkee doesn't disappear after delivery. We stay involved, accountable for the results, adjusting as the business evolves.
Your data already has the answer. What's missing is the structure to hear it.
If your operation still depends on manual spreadsheets, if the report takes days to close, if each department has a different number for the same metric: the data exists. What's missing is the path between it and the decision.
Wolkee maps that path. No commitment, no rigid scope.
Tell us about your situation. Wolkee knows how to unlock it.
Frequently asked questions
What is the difference between BI and Excel?
Excel is a tool; BI is a process. A spreadsheet depends on someone exporting, pasting and checking the data every time, and each copy becomes a different version of the number. BI integrates the systems and refreshes the dashboard automatically, with the same calculation rules for everyone.
Is Power BI the same as business intelligence?
No. Power BI is a Microsoft analytics and visualization tool; business intelligence is the full process, from integrating systems to making the decision. Without integrated, validated data with a clear owner, Power BI shows good-looking charts with numbers nobody trusts.
What are the main BI tools?
Among the best-known BI tools are Power BI, Tableau, Looker Studio and Qlik. They handle visualization, but they depend on a well-built data foundation in SQL, Python or Microsoft Fabric. When the indicator needs to live inside a portal or system, a custom web dashboard is also an option.
How do you start implementing BI in a company?
Start with a business question, not the tool. Pick an important decision that today depends on manual spreadsheets, map which systems the data comes from and define the owner of each indicator. That first dashboard becomes the model for the next departments. Wolkee offers a free 30-minute assessment to map that starting point.