Call center KPIs: the metrics every manager needs to track
Call center KPIs explained: service level, AHT, ASA, abandonment, FCR, CSAT, occupancy and absenteeism, with formulas, common traps and dashboard tips.
In short
- Track call center KPIs in three groups: access (service level, ASA, abandonment), resolution (AHT, FCR, CSAT/NPS) and people (occupancy, adherence, absenteeism).
- Never push AHT on its own: when it drops together with FCR, the team is rushing customers and repeat calls drive up volume and cost.
- Keep the real-time operational view, used by supervisors to act within the interval, apart from the historical management view, used to decide headcount, training and processes.
- Before building the dashboard, write down the definition of each formula and integrate telephony, WhatsApp and CRM, because each platform calculates metrics its own way.
A contact center generates numbers all day long: calls, queues, breaks, surveys, tickets. The problem is rarely a lack of data. It is looking at one metric in isolation and making the wrong call, such as pushing for a lower AHT and, without noticing, increasing repeat calls.
The essential customer service KPIs fit in a short list: service level, ASA, abandonment, AHT, FCR (first contact resolution), CSAT/NPS, occupancy, schedule adherence and absenteeism. Together, they answer three questions: can customers get through, was their problem solved, and is the team sized correctly?
In this guide you will see what each metric measures, how to calculate it, its most common trap and how to read them all together. At the end, we show how to separate real time from history, how to organize the dashboard, and a checklist to get started.
What are the main call center KPIs?
It helps to group the metrics by the question each one answers. That way, when a number gets worse, you know where to look for the cause.
- Access: service level, ASA (average speed of answer) and abandonment rate. They show whether customers can reach someone.
- Resolution and quality: AHT (average handle time), FCR and CSAT/NPS. They show whether the contact solved the issue and how the customer felt.
- People: occupancy, schedule adherence and absenteeism. They show whether the right team is in the right place at the right time.
No group is enough on its own. An operation can have a great service level because it is overstaffed, or a great AHT because it is pushing customers into a second contact.
Access metrics: can customers get through?
Service level
It measures the percentage of contacts answered within a target time, such as 80% of calls within 20 seconds. Calculation: calls answered within the target time divided by the total calls that entered the queue. Trap: each platform handles abandoned calls differently, and the daily average hides the peaks. A day at 80% may have been at 40% at 10 am, exactly when most customers called.
ASA (average speed of answer)
It measures how long, on average, customers waited in the queue before being answered. Calculation: total wait time of answered calls divided by the number of answered calls. Trap: the average hides the tail. An ASA of 30 seconds can coexist with customers waiting ten minutes. Also track the longest wait in each interval.
Abandonment rate
It measures how many customers gave up before being answered. Calculation: calls abandoned in the queue divided by calls that entered the queue. Trap: counting abandonments of a few seconds, which are usually wrong numbers, and mixing customers who gave up in the IVR (the automated menu) with those who gave up in the queue. Write down the short-abandonment threshold and separate the two.
Resolution and quality metrics: was the problem solved?
AHT (average handle time)
It measures the average length of a contact, from hello to the end of the record. Calculation: talk time, plus hold time during the call, plus after-call work (the wrap-up), divided by the number of contacts handled. Trap: turning it into a standalone target. When AHT is pushed on its own, agents end calls early, transfer more and customers call back. AHT drops, volume goes up and so does cost.
FCR (first contact resolution)
It measures the percentage of requests solved without the customer having to come back. Calculation: contacts resolved on the first contact divided by total contacts. In practice, it is measured by survey or by the absence of a new contact from the same customer, on the same subject, within a window such as seven days. Trap: relying only on the agent's own wrap-up code and ignoring the customer who called and then came back on WhatsApp.
CSAT and NPS
CSAT measures satisfaction with that specific contact: satisfied responses (for example, scores of 4 and 5 on a 1-to-5 scale) divided by total responses. NPS measures willingness to recommend the brand: percentage of promoters (scores of 9 and 10) minus percentage of detractors (scores of 0 to 6). Trap: evaluating agents by NPS, which also reflects product, price and billing, and drawing conclusions from small samples.
People metrics: is the team sized correctly?
Occupancy
It measures how much of their available time agents actually spent handling contacts. Calculation: handling time (talk, hold and after-call work) divided by time logged in and available to take contacts. Trap: assuming higher is always better. Very high occupancy for weeks in a row signals no slack, fatigue and turnover risk. Very low occupancy means there are too many people in that interval.
Schedule adherence
It measures whether agents were in the state the schedule planned, at the planned time: logged in, on break, at lunch or in training. Calculation: minutes in line with the schedule divided by scheduled minutes. Trap: confusing it with working the full shift. An agent can work all six hours and still take a break at the peak, dragging down the service level.
Absenteeism
It measures unplanned absences. Calculation: hours of unplanned absence divided by scheduled hours. Trap: mixing vacations and training, which are planned, with no-shows and late arrivals, and looking only at the monthly average. The pattern usually shows up by weekday, shift or team, and that is where it hurts service.
How do you read customer service KPIs together?
The value is in the combinations. A few readings that help day to day:
- AHT and FCR falling together: the team is rushing customers, and repeat calls will increase volume.
- High service level and low occupancy: there are extra people in that interval who could move to another channel or to back office.
- Low service level, high occupancy and good adherence: the problem is staffing or volume forecasting, not discipline.
- Low service level with low adherence: the people exist, but they are not logged in at the right time. Review breaks and start times.
- Good CSAT and poor NPS: service is going well, but dissatisfaction comes from product, price or processes outside the contact center.
- High abandonment with moderate ASA: investigate the IVR, specific queues and abandonment by interval, not just the average.
This cross-reading is also the foundation for using AI in customer service safely. Without reliable metrics, it is hard to know whether a bot solved the problem or just passed it on, a topic we discuss in AI in call centers and the data bottleneck.
Real time or history: how should you organize the dashboard?
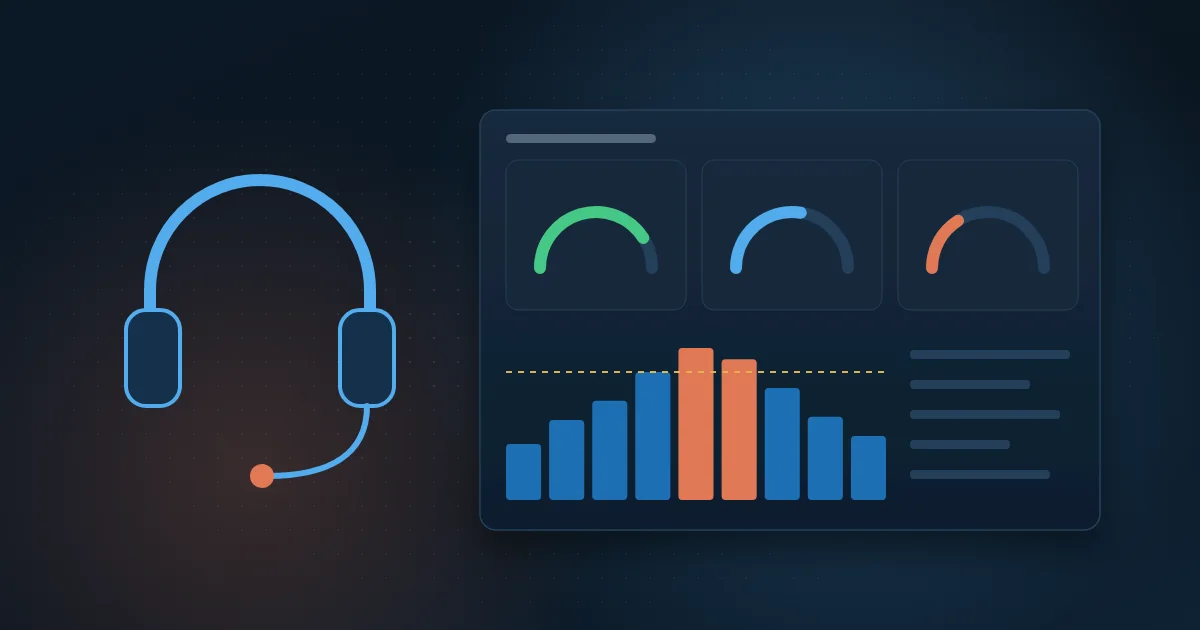
Real time and history answer different questions and serve different audiences. Mixing both on the same screen is one of the most common mistakes.
Operational view (real time)
This is the screen for supervisors and the workforce planning team, refreshed every few seconds or minutes. It shows calls in queue, current longest wait, service level for the current interval, agents by state (available, on a contact, on break) and live adherence, by queue and channel. A few large numbers, with color when something misses the target. It is for acting now: moving agents, holding breaks, opening overflow.
Management view (history)
This is the dashboard for coordinators and leadership, by day, week and month. It puts the three groups side by side, compares actuals with target and forecast, and lets you drill down by operation, queue, channel, team and contact reason. This is where FCR, CSAT/NPS, absenteeism and AHT trends belong. It is used to decide headcount, training and processes, and to track the contract SLA (service level agreement). You can see how a customer service dashboard works in our interactive examples gallery.
Where does the data come from?
The numbers are scattered. The telephony or omnichannel platform, such as Avaya, Genesys, Five9 or Nice, provides queues, calls and agent states. WhatsApp and chat provide digital conversations. The CRM provides case numbers and customer history, which is essential to measure FCR across channels. Add the survey tool, the schedule and time tracking. The challenge is that each system names and calculates metrics its own way, so the dashboard needs a single definition and a common customer identifier.
Checklist: where do you start?
- Write down the definition of each metric: service level target time, short-abandonment threshold and FCR repeat-contact window.
- List the data sources and the owner of each one: telephony, digital channels, CRM, surveys, schedule and time tracking.
- Start with the metrics in the contract and at least one from each group: access, resolution and people.
- Set targets and measurement intervals: 15 or 30 minutes for operations, day and month for management.
- Keep the operational view apart from the management view, each with its own audience and refresh frequency.
- Check the dashboard numbers against the platform's native reports for a few weeks.
- Create a routine: a short daily huddle with the operational view and a monthly meeting with the management view, always with a recorded action.
- Review every quarter. Any metric nobody uses to make decisions comes off the dashboard.
How Wolkee helps
Wolkee integrates contact center platforms such as Avaya, Genesys, Five9 and Nice with CRM and digital channels, and delivers contact center dashboards with operational and management views in up to 15 days. At MetLife, BI integrated with Avaya cut data consolidation time by 60% and increased management productivity by 35%.
If you want to organize your operation's metrics, start with a free 30-minute assessment. We show you a working prototype before the contract and reply within 1 business day.
Frequently asked questions
What is the difference between AHT and ASA?
ASA measures how long customers wait in the queue before being answered; AHT measures the length of the contact itself, adding talk time, hold time during the call and after-call work. ASA is about access and team sizing. AHT is about efficiency and the complexity of the contact. Both should be read together with FCR.
What is a good service level in a call center?
There is no single number. The most cited reference is 80/20, meaning 80% of calls answered within 20 seconds, but the right target depends on the channel, the contract and the type of customer. An emergency line demands more; an email channel accepts response times in hours. What matters is measuring by interval, not just by the daily average.
Is there an ideal AHT?
There is no universal ideal AHT. It depends on the type of contact: issuing a duplicate bank slip (boleto) takes less time than handling a billing dispute. Compare AHT by contact reason and over time, always alongside FCR and CSAT. A low AHT with many repeat calls costs more than a slightly higher AHT that solves the problem.
Which metrics should you use for WhatsApp and chat support?
The logic is the same as voice, with adjustments. Service level is usually measured by time to first response, and abandonment by conversations closed without a reply. Since one agent handles several conversations at once, AHT and occupancy need to account for that concurrency. FCR and CSAT work the same way, as long as the customer is identified across channels.