Power BI financial dashboard: what to show the board and how to build it
Power BI financial dashboard: which indicators to show the board, how to organize the pages, where the data comes from and how to keep the numbers reliable.
In short
- A financial dashboard for the board answers a few questions: how much cash came in and went out, whether results are within budget and what is worrying in the coming weeks.
- The first page shows six to eight indicators with targets and comparisons; the following pages drill into cash, results, receivables and payables.
- The data comes from the ERP, bank statements and the budget spreadsheet, and needs written calculation rules validated with the controller's team before the first meeting.
- Trust is built with totals that match the accounting books, a visible refresh date and controlled access so each manager sees only their area.
Every board meeting starts with the same question: how are we doing? In many companies, the answer is still an Excel file with many tabs, built by the finance team in the days before, which arrives with numbers from weeks ago and raises more questions about where the data came from than discussion about the business.
A financial dashboard in Power BI solves this when it is designed for decision makers. It brings together cash, results, budget, receivables and payables in one place, refreshed automatically, with the same calculation rules every month. The secret is not in the charts, but in choosing a few questions and answering them well.
In this guide you will see what the board needs to see, how to organize the pages, where the data comes from, a step-by-step implementation and the mistakes that make the dashboard lose trust.
What does the board need to see in a financial dashboard?
The board does not want to check journal entries. It wants to know whether the company is healthy, whether the plan is being met and where to act. That is why the first page should fit on one screen and show six to eight indicators, each with the target or budget next to it and a comparison with the same period of the previous year. The most common indicators are:
- Net revenue for the month and year to date, against budget.
- Gross margin and contribution margin, to know how much is left from each sale.
- EBITDA, operating results before interest, taxes, depreciation and amortization.
- Cash balance today and the forecast for the coming weeks.
- Overdue receivables and average collection period.
- Payables for the coming weeks and average payment period.
- Fixed expenses against budget, by cost center.
Each indicator needs a written definition: what goes in, what goes out, which system it comes from and on which date it is counted. Without this, the same number shows up differently in the dashboard and in the controller's spreadsheet, and the meeting becomes an argument about the calculation.
How should you organize the dashboard pages?
A structure that works well goes from general to detail, with one page per question. Those who only want the overview stop at the first page; those who need to investigate move on to the others.
Overview
The main indicators with target, comparison and an arrow or color showing whether they improved or worsened. No long tables here.
Results
The summarized income statement, with actual against budget and the ability to open each line down to the cost center. If the income statement does not exist in Power BI yet, the guide to the management income statement in Power BI shows how to build the chart of accounts mapping, subtotals and margins.
Cash
Balance by bank, inflows and outflows for the period and the forecast for the coming weeks, adding up what is to be received and paid. This is the page that most often prevents surprises.
Receivables and payables
Invoices by overdue range, largest debtor customers, concentration of payments per week and most relevant suppliers. Here detail is useful, because the question is who to collect from and what to negotiate.
Where does the data for a financial dashboard come from?
Almost always from three or four sources, and each one has its own pitfalls:
- ERP: accounting entries, receivables and payables, invoices and cost centers. It is the main source and the one that defines the rule.
- Banks: statements for the balance and reconciliation, through integration or exported files.
- Budget: usually a spreadsheet, which needs a fixed layout and someone responsible for maintaining it.
- Operational systems, such as CRM or contracts, when the board wants to see recurring revenue or the future pipeline.
When the company has several sources or several legal entities, it is worth storing the processed data in a central base, such as a data warehouse, instead of connecting Power BI directly to each system. That way, revenue in the financial dashboard is the same as in the sales dashboard.
How to build the financial dashboard, step by step
- List with the board the five to ten questions the dashboard must answer at every meeting.
- Write the definition of each indicator with the controller's team: formula, source, cutoff date and exceptions.
- Map the sources and how to access each one: the ERP database, API, exported file or spreadsheet.
- Build the data model with a calendar table, the chart of accounts, cost centers and companies.
- Build the overview first and validate the numbers against a month that has already been closed.
- Add the detail pages, one per question, always starting from the same model.
- Define the scheduled refresh, who gets access and what each person can see.
- Run the dashboard in parallel with the old report for one or two closings before retiring the spreadsheet.
Step five is the most important. If the dashboard matches a closing the controller's team already knows, the board trusts it from the very first meeting.
How do you make sure each person sees only what they should?
Financial data is sensitive. The board sees everything, but a branch manager should see only their unit, and a cost center owner only their expenses. In Power BI this is solved with row-level security, which filters the data according to the user. The article on RLS in Power BI explains how to set it up without duplicating reports.
Which charts should you use for each indicator?
The right chart is the one that answers the question without explanation. Some choices that work well in financial dashboards:
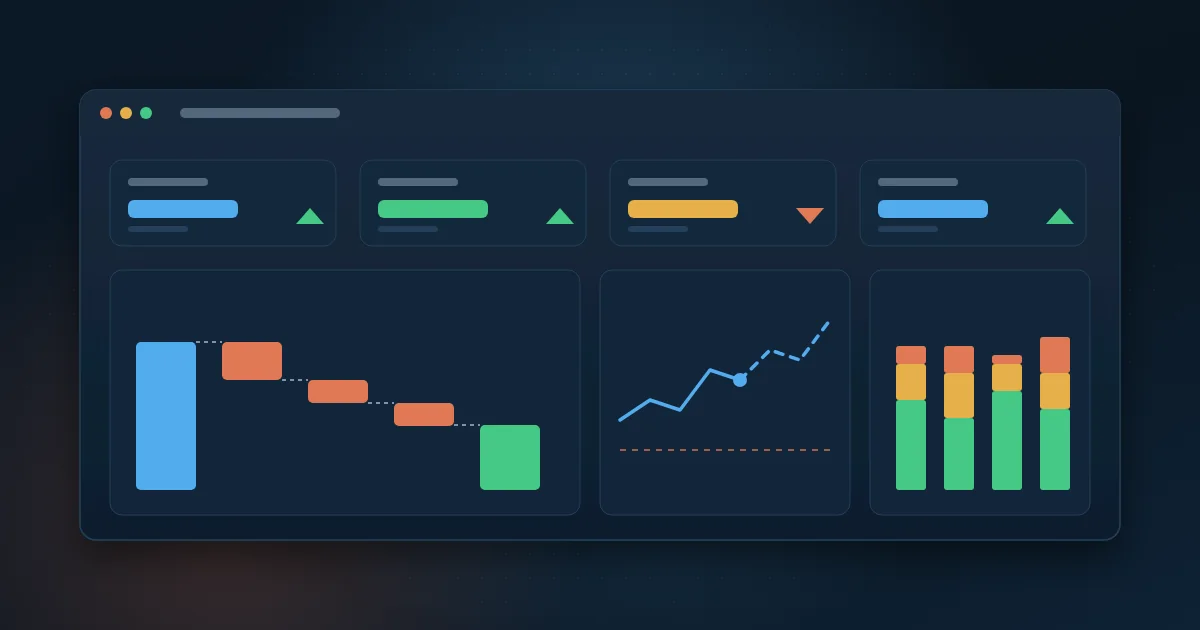
- Cards with the number, the target and the variance for the overview indicators.
- Lines for trends over the months, such as revenue and margin, with budget as a reference line.
- Waterfall charts to explain how revenue becomes profit, line by line of the income statement.
- Stacked bars by overdue range for receivables.
- Tables only on the detail pages, with filters by company, cost center and period.
Avoid pie charts with many slices, colors without meaning and bar scales that do not start at zero. Use the same color for actual and another for budget on every page: the board learns how to read it once and does not need to learn again.
How should the dashboard be used in the board meeting?
The dashboard changes the dynamics of the meeting. Since the numbers are available beforehand, time is no longer spent presenting results and is used to decide. A simple routine: open the overview, discuss only the indicators off target, drill into each one and record who does what before the next meeting.
For those who prefer to receive the numbers without opening the dashboard, Power BI allows, depending on the license, subscribing to a page sent periodically by email. If the goal is also to eliminate hand-built reports, the guide to report automation shows what to prioritize.
Which mistakes make the board distrust the dashboard?
- Numbers that do not match the accounting books and no one can explain the difference.
- A dashboard with no visible refresh date: no one knows whether the number is from today or last month.
- Too many indicators on the first page, with no target or comparison.
- A budget loaded from a spreadsheet that changes layout with every revision.
- Calculation rules written only in the head of whoever built the report.
- Access open to everyone, or too restricted, making people go back to asking for spreadsheets by email.
How Wolkee helps
Wolkee provides end-to-end Power BI consulting for finance teams: we define the indicators with the controller's team, integrate the ERP, banks and budget, build the model and the pages and set up each manager's access. We have 9 years in the market and more than 500 deliveries, in projects in 8 countries.
If your board meeting still depends on a hand-built spreadsheet, book a free 30-minute assessment. We reply within 1 business day and, when it makes sense, we show a working prototype before the contract.
Frequently asked questions
Which indicators are essential in a financial dashboard?
Revenue against budget, margin, EBITDA, cash balance and forecast, overdue receivables and payables for the coming weeks. With these, the board understands results, liquidity and short-term risk. Other indicators depend on the business, such as recurring revenue in service companies or inventory turnover in retail and manufacturing.
Can you build a financial dashboard in Power BI using Excel?
Yes, and it is a good start. Power BI reads spreadsheets and can refresh them if they are in a fixed location, such as SharePoint or OneDrive. The risk is the spreadsheet changing layout or being edited by hand. For numbers that go to the board, ideally the data comes straight from the ERP and only the budget stays in Excel.
How often should the financial dashboard be refreshed?
It depends on the question. Cash and receivables are usually refreshed once or several times a day, because the decision to collect or pay is daily. Results and budget make more sense after the accounting close, when the entries are complete. What matters is showing on the dashboard the date of the last refresh of each page.
What is the difference between a financial dashboard and an income statement in Power BI?
The income statement is one of the pieces of the financial dashboard. It shows revenue, costs, expenses and results for a period. The financial dashboard goes further: it combines the income statement with cash, receivables, payables and budget, so the board sees results and liquidity at the same time. Many companies start with the income statement and then expand.

Partner and Sales Director at Wolkee
He started on the technical side, moved into consultative pre-sales and today follows Wolkee's BI, data and automation projects from diagnosis to delivery.
LinkedIn