Business intelligence cost: what goes into the price of a BI project
How much does business intelligence cost? See what goes into a BI project, what Power BI licenses cost and how to estimate your budget.
In short
- The cost of business intelligence adds up three parts: the implementation project, licenses and data infrastructure, and ongoing support after the dashboards go live.
- What moves the price of a project most is the sources, data quality, refresh frequency and business rules, not the number of screens.
- On Microsoft's official price list, Power BI Pro costs US$14 and Premium Per User US$24 per user per month, paid yearly.
- To estimate the budget, map decisions, data sources and users, start with one area and ask for proposals that separate project, licenses and support.
Anyone who searches for the cost of business intelligence usually finds two unhelpful answers: a number with no context, or an "it depends" with no explanation. Both get in the way of the conversation with leadership, who need to approve a budget and understand what they are buying.
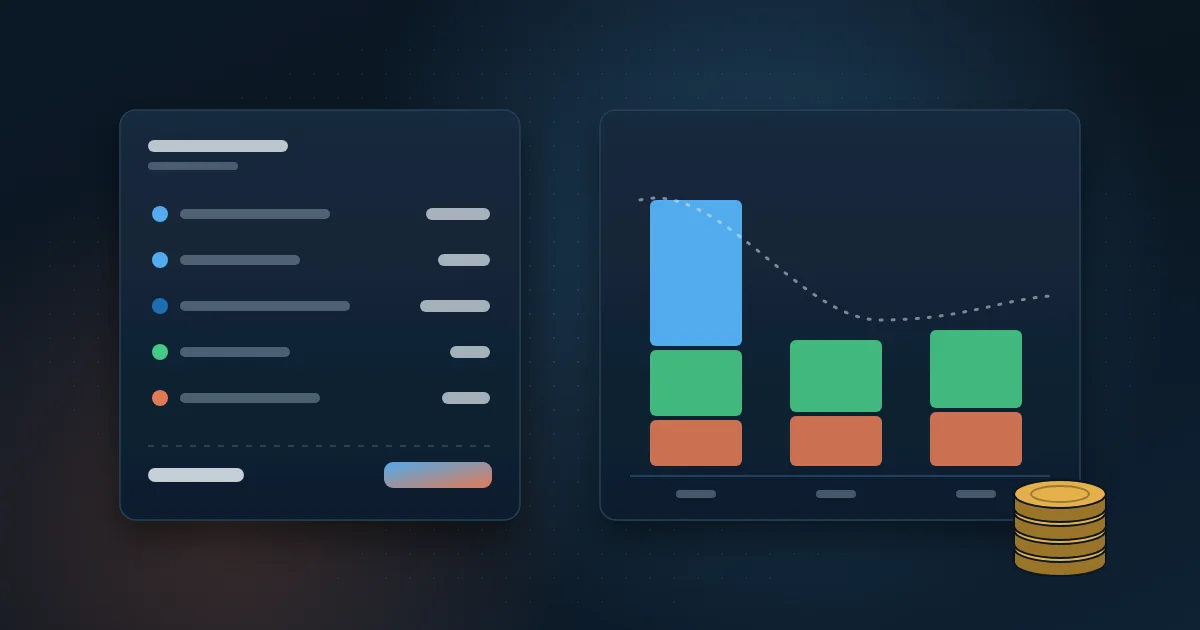
The short answer: there is no list price for a BI project, but there is a clear way to build the estimate. The total cost adds up three parts. The first is the project, that is, the work of gathering requirements, integrating the data, building the model and creating the dashboards. The second is licenses and infrastructure, such as Power BI and the database where the data lives. The third is ongoing support, what it takes to keep everything running and improving after delivery.
In this guide you will see what goes into each part, what makes the cost go up or down, what Power BI licenses cost according to Microsoft, and a step-by-step way to estimate the budget for your case.
What goes into the cost of a BI project?
The project is the part that varies most from one company to another. A good proposal shows the stages and the effort in each one, not just a list of dashboards. In general, the work breaks down like this:
- Assessment: understanding which decisions the BI needs to support, who will use it and where the data comes from.
- Data integration and engineering: connecting ERP, CRM, spreadsheets and other systems, fixing inconsistencies and organizing the data in one place.
- Modeling and calculation rules: defining how each metric is calculated, such as margin, average ticket or service level, and validating it with the business area.
- Dashboards: designing the screens, filters and navigation for each audience.
- Testing and reconciliation: comparing the dashboard numbers with the source systems before granting access.
- Rollout: publishing, setting up automatic refresh and access, and training the people who will use it.
Notice that the dashboards are only one of the stages. In most projects, the biggest effort comes before them, in bringing the data together and cleaning it. That is why two proposals with the same number of screens can have very different prices.
What makes the price of a BI project go up or down?
Number and type of data sources
Every connected system means more work. An ERP with an accessible database is simpler than a system that only exports spreadsheets or requires an API (the interface that lets one system exchange data with another). On-premises sources, inside the company network, also need a gateway, the connector that brings that data to the cloud service.
Data quality
Duplicate records, different codes for the same customer in each system and hand-filled spreadsheets increase the cleanup time. When the sales numbers do not match finance, someone has to find out why before building any dashboard.
Refresh frequency
Refreshing once a day is simpler than refreshing every 15 minutes or in real time. High frequencies require a more careful data architecture and, in some cases, a larger Power BI capacity. It is worth asking whether the decision really needs data from the last minute.
Business rules and audience
Metrics with complex rules, such as cost allocations, targets by region or multiple currencies, take longer to define and test. The audience matters too: controlling who sees what with row-level security, or showing reports to external customers, adds security and licensing steps.
How much do Power BI licenses cost?
Licenses are the easiest part to look up, because they have a public price. According to Microsoft's official Power BI pricing page, checked in October 2026, the main options are these:
- Free Power BI: lets you create reports in Power BI Desktop, but not share them with other people.
- Power BI Pro: US$14 per user per month, paid yearly, to publish and share reports. It is already included in Microsoft 365 E5 and Office 365 E5.
- Power BI Premium Per User: US$24 per user per month, paid yearly, with larger models and more frequent refreshes.
- Microsoft Fabric capacity: variable price depending on size, with pay-as-you-go or a discounted annual reservation. From F64 up, people who only view reports do not need a paid license.
- Power BI Embedded: variable price, to show reports inside your own portal or system.
These are list prices in US dollars, and Microsoft raised them in April 2025. In other countries the final price is charged in local currency and may vary by purchasing channel and agreement, so confirm it when you buy.
The rule of thumb: with few users, per-user licensing is usually the cheapest path. With many people who only consume reports, a dedicated capacity may pay off. For external customers and partners, it is worth learning about Power BI Embedded and report portals. Remember that, even on a capacity, whoever publishes content still needs a Pro license.
What costs show up after the dashboard goes live?
Many budgets stop at delivery and forget what comes next. Include in the estimate:
- Data infrastructure: a cloud database, storage and the gateway server when there are on-premises sources.
- Licenses that grow with the team: each new user who publishes or accesses shared content may need a license.
- Support: monitoring refreshes, fixing failures and answering users' questions.
- Evolution: new metrics, new areas and adjustments when business rules change.
- Training: onboarding new users and the people who will maintain the reports.
Infrastructure depends on where the data lives. In smaller projects, Power BI itself can store the cleaned data. When there are many sources or many dashboards using the same numbers, a data warehouse usually organizes the foundation better and avoids rework, with a monthly cloud cost that needs to be in the budget.
How are BI projects usually billed?
The billing model changes how you compare proposals. The most common models are:
- Fixed scope: one price for a defined set of deliverables. It works well when the scope is clear, and changes along the way become add-ons.
- Hour bank: you buy a block of hours and use them as needed. It is flexible, but you need to track consumption.
- Monthly fee: covers support and continuous improvement and, in some cases, report hosting. It trades part of the upfront investment for a recurring cost.
There is no right model for everyone. What matters is that the proposal makes clear what is included, what is left out and who owns the files, the data and the access at the end.
How do you estimate the budget for your BI project?
Before asking for proposals, gather this information. It makes estimates more accurate and makes it easier to compare vendors:
- List the decisions the BI needs to support and who will make them, by area.
- Map the data sources: which systems, how the data can be accessed and who is responsible for each one.
- Assess quality: do the numbers from different areas match?
- Define how often the data needs to be refreshed.
- Count the users: how many will publish, how many will only view, and whether there is an external audience.
- Choose the scope of the first delivery, preferably one area or one topic.
- Ask for proposals that separate project, licenses, infrastructure and support.
- Ask for a prototype with your own data before signing the contract.
With these answers in hand, it is easier to compare proposals on what matters. To evaluate the vendors themselves, see also how to choose a Power BI consultancy.
How can you reduce the cost without losing results?
- Start with one area that has a clear pain point and accessible data, and expand later.
- Use the licenses the company already has, such as the Power BI Pro included in Microsoft 365 E5.
- Ask for the refresh frequency the decision requires, not the highest possible one.
- Invest in the data foundation: a well-built model serves several dashboards without redoing the work.
- Require documentation, so future changes do not depend on whoever built it.
To know whether the investment pays off, measure before you start: how many hours a week the team spends consolidating spreadsheets, how many errors show up in reports and how long it takes to answer a question from leadership. At MetLife, for example, BI integrated with Avaya cut data consolidation time by 60% and increased management productivity by 35%.
How Wolkee helps
At Wolkee, the same senior team builds dashboards and BI in Power BI, Tableau and web, along with the data engineering, integrations and automations. That means 9 years in the market, more than 500 deliveries and projects in 8 countries, in areas such as solar energy, contact centers, sales and finance.
If you need to put together a BI budget, start with a free 30-minute assessment. We help you map sources, users and scope, reply within 1 business day and, when it makes sense, present a working prototype before the contract.
Frequently asked questions
How much does Power BI cost per user?
On Microsoft's official price list, checked in October 2026, Power BI Pro costs US$14 per user per month and Premium Per User costs US$24, both paid yearly. Prices in other currencies may vary. On Microsoft Fabric capacities from F64 up, people who only view reports do not need a paid license.
Is free Power BI enough for a company?
It works for creating and testing reports, but not for sharing them. The free version runs in Power BI Desktop, and to publish and distribute reports to other people you need a Pro or Premium Per User license or a dedicated capacity. It is a good way to validate an idea before investing, but it does not replace licensing for a BI the team uses.
Why do BI quotes vary so much between vendors?
Because each proposal may include different things. One covers only the dashboards; another includes data integration, number reconciliation, documentation and training. The assumptions about sources, data quality and refresh frequency also change. To compare fairly, ask each vendor to break out the stages and describe what is out of scope.
How do you calculate the total cost of BI over time?
Add up the implementation project, the licenses multiplied by the number of users, the cloud data infrastructure and monthly support over a two- or three-year horizon. Then compare it with today's cost: hours spent building spreadsheets, report errors and delayed decisions. That total cost is the most honest basis for approving the investment.